Bottleneck Calculator
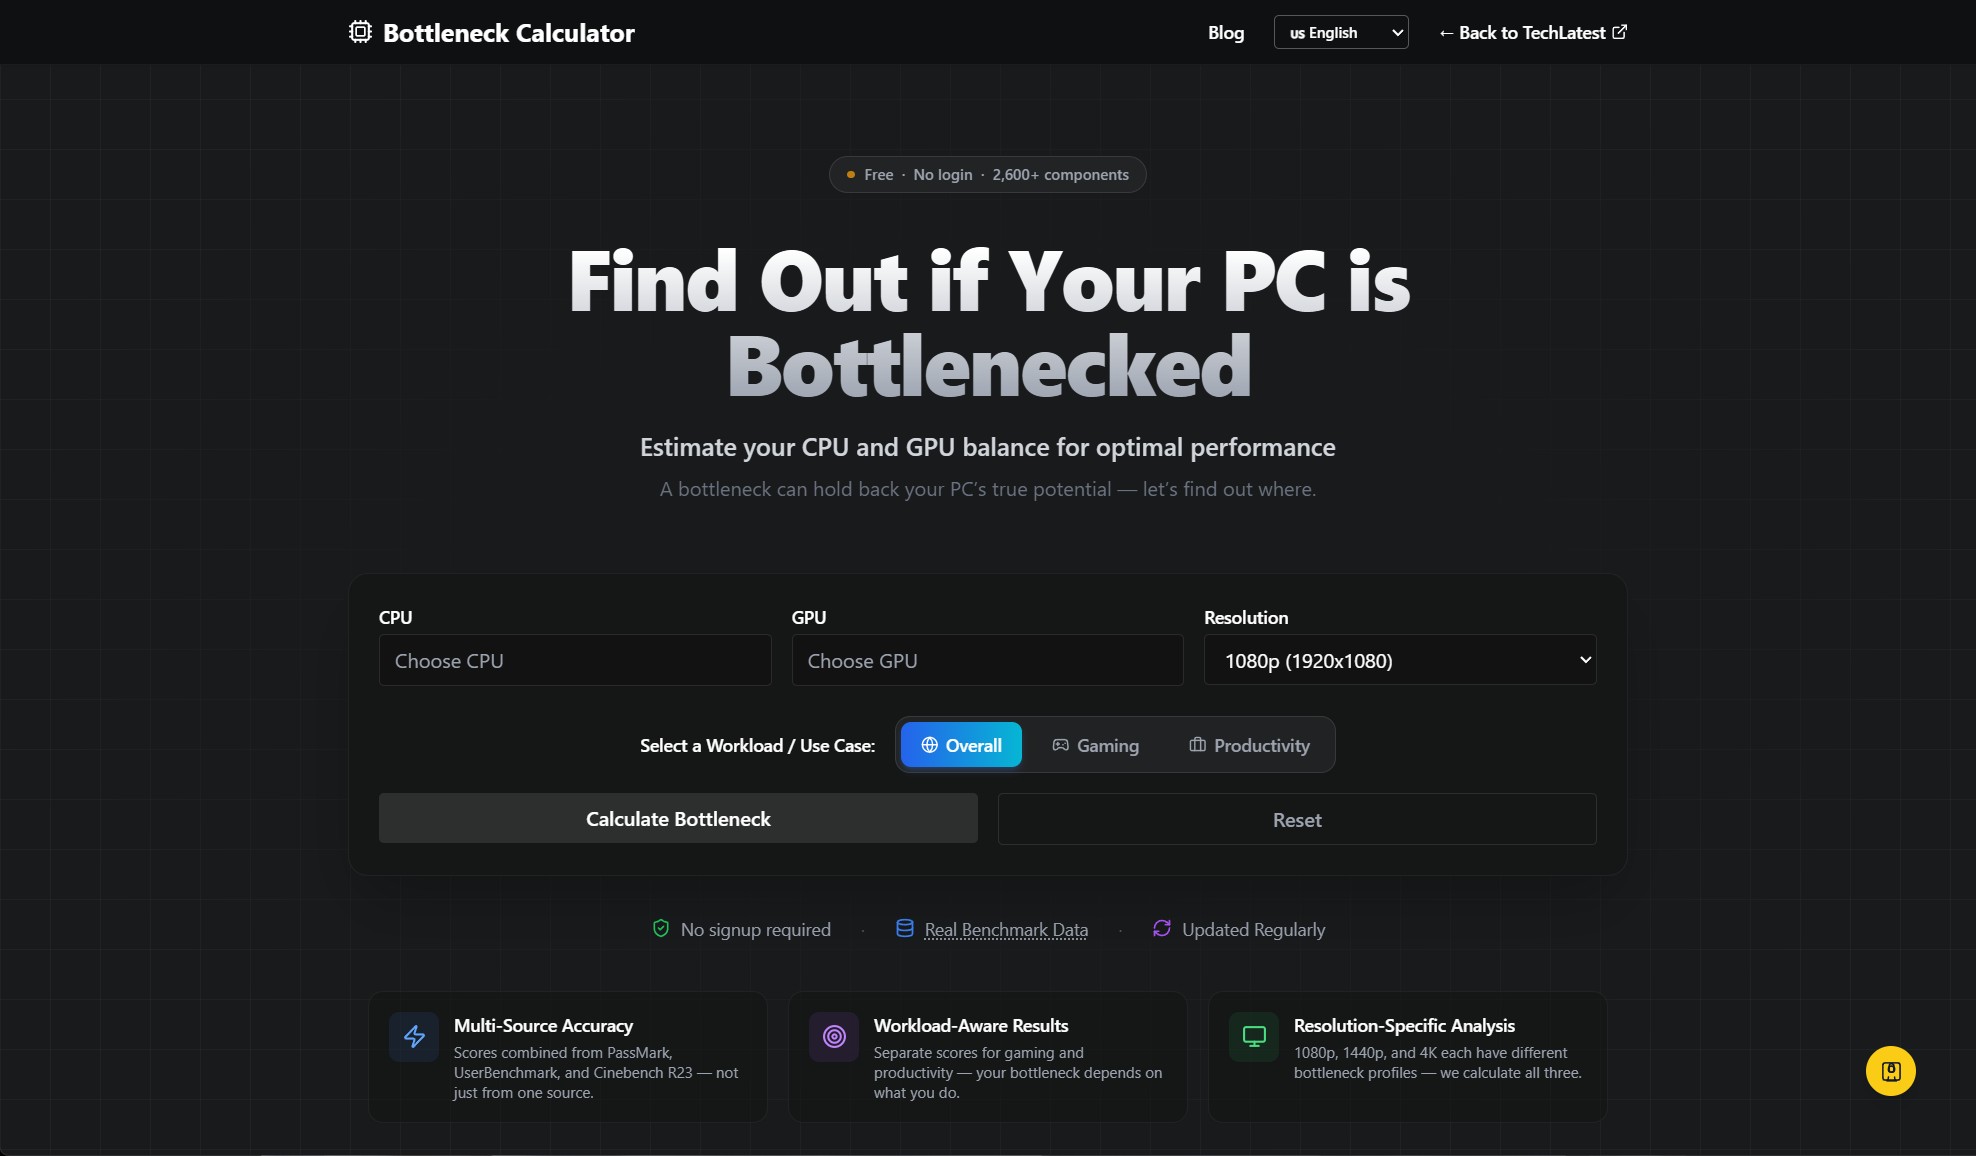
Visualise CPU/GPU bottlenecks and get upgrade suggestions for balanced PC builds.
1,434
CPUs scored
0–10000
Score scale
S–D
Tiers
85%
Cinebench imputed
01 / The problem
Min-max normalized scores broke every time a new flagship GPU shipped — when the RTX 5090 joined the dataset, its outlier score compressed every other card's rank even though nothing about them had changed.
02 / The approach
Switched to percentile-based ranking, which is stable against new outliers, combined with geometric-mean weighting across benchmark sources so a component has to be consistently strong — not just spike in one test — to score well.
03 / The catch
Percentile scores are rank-preserving but not ratio-preserving. Feeding them directly into FPS Calculator's CPU/GPU ratio math produced absurd predictions — 350 FPS in Valorant for a GTX 1060 — so a separate ratio-preserving raw score had to be exposed just for that math.
Web-based tool that analyses CPU/GPU combinations, computes bottleneck percentages, and recommends balanced upgrades. React + Vite + Tailwind frontend backed by a FastAPI Python service serving calibrated JSON benchmark datasets. Shares the same benchmark API layer as FPS Calculator.
Highlights
1,434 CPUs scored; ~85% missing Cinebench data imputed via regression (R²≈0.90)
Percentile normalization survives new-hardware outliers without reshuffling every existing score
Same benchmark API powers FPS Calculator's predictions — one shared scoring engine across both sites
Upgrade suggestions tuned per resolution and workload (gaming / productivity / overall)
Gallery